Currently the EPA is evaluating the sources of pollution or…
Next generation Pollution Impact Potential maps launched
Pollutant Impact Potential (PIP) maps for Nitrogen (N) and Phosphorus (P) have been generated to show the highest risk areas in the landscape for losses of N and P to waters. These maps, including flow paths and delivery points, do not indicate specific areas that have a problem, and they are not designed or suitable to be used on their own as a basis for decisions at field scale. They can be used however to target measures in catchments where monitoring data have indicated that there is a problem.
These maps act as signposts for where further characterisation and engagement actions should be prioritised.
The PIP models estimate the annual nutrient losses from agricultural land at that specific locations, using spatial data on farm management, soils and hydrogeology. As this model is estimating loads at an annual temporal resolution, it is useful to provide information to compare relative potential nutrient sources. Local knowledge and evidence will always be needed to have confidence about temporal changes in water quality throughout the year.
Nitrogen and Phosphorus behave very differently in the landscape
High risk areas for phosphorus loss typically have poorly draining soils and dominant overland flow pathways. Whereas with freely draining soils and substantial groundwater pathways are high risk for nitrogen losses. These characteristics are reflected in the nutrient attenuation factors for the hydrogeological flow pathways developed in the Pathways project (Archbold et al., 2016).
Teagasc Signpost Seminar – national problems, local solutions
On 30 April 2021, Jenny Deakin from the EPA Catchments Unit gave a presentation on ‘Water quality: national problems, local solutions’ as part of the Teagasc Signpost Seminar. This presentation highlighted the new PIP Maps and looked at the Blackwater catchment as a case study.
Pollutant Impact Potential for Nitrate (PIP-N)
Nitrate Critical Source Area (CSA) are where there is a source of N from agricultural areas and the land is susceptible to losses.
The PIP-N: CSA map uses 2018 farm management data for Bovine, sheep and crops from DAFM. Pigs and poultry data were not available for this release. Data are used to map the spatial distribution of livestock in the landscape based on several assumptions, such as that the animals are distributed evenly across the grassland parcels of each farm. The excretion calculations use annual values from the GAP regulations relating to 2018 with animal numbers and types for each farm holding AIM data (e.g. 1 dairy = 85 kg N/year, 1 suckler = 65 kg N/year, etc.).
Areas are assigned a ‘High PIP’ (Rank 1, 2 or 3) typically due to the presence of freely draining soils and moderate/high livestock intensity, where nitrate losses to water are predicted to be over 35 kg/ha/yr. PIP-N Rank 1, 2 and 3 each cover 5% of the total land area (approx. 3,400km2). Target these areas in At Risk water bodies where nitrate is the significant issue and farming is the significant pressure.

Pollutant Impact Potential for Phosphorus (PIP-P)
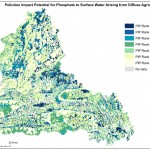
The PIP-P map is now made of three layers that are combined to visualise the movement of P losses across the landscape. The overland flow paths overlaid on the CSA map are based on research from the EPA DiffuseTools Project.
PIP-P: Critical Source Area Map
Phosphorus Critical Source Areas (CSAs) are where there is a diffuse source of P from agricultural areas and the land is susceptible to losses. Source loadings data for bovine, sheep and crops are based on 2018 farm management data from DAFM. A ‘High PIP’ (Rank 1, 2 or 3) area is typically due to the presence of poorly draining soils and moderate/high livestock intensity. Target these areas in At Risk water body in which phosphate is the significant issue and farming is the significant pressure.

PIP: Focussed Delivery Flow Paths
Focussed Delivery Flow Paths are the areas of converging runoff that results in an increasing accumulation of flow. It is important to consider the available source of phosphorus in these contributing areas when deciding whether to target measures (check the underlying PIP-CSA rank). The red flow paths have the highest surface runoff. Where these cross High PIP areas, expect higher P losses. The map can highlight areas to target phosphorus pathway interception actions e.g. hedgerows.
Focussed Delivery Flow Points
Focussed Flow Delivery Points are where Focussed Flow Paths enter a watercourse. The size of the point indicates the relative volume of flow delivered to water. It is important to consider the available source of phosphorus in the upslope contributing areas. The map can highlight areas to target phosphorus pathway interception actions e.g. riparian/buffer zones, woodlands, engineered ditches.

flow paths and focused delivery flow points
Viewing these Maps
The new PIP maps are available to view on the EPA Water Map: https://gis.epa.ie/EPAMaps/Water
Please note: these layers are very large and may take some time to load in your browser. For best results, use Chrome or Edge. If you are encountering issues, clearing your cookies and cache on your browser may help.

PIP Version 3 Release Notes
The agricultural management data has been updated to 2018 in PIPv3 (from 2012 in PIPv2).
Only grass and crop land parcels included in DAFMs 2018 dataset are assigned ranks in the PIPv3 release (forestry will be included in the next version). A new map of artificially drained grassland has been incorporated for the border, midlands and western regions (O’Hara et al., 2020).
The PIP-N v3 Ranks have updated ranges of nitrate losses due to the significant increase in loadings and losses to water. A new python model (PIPpy) had been developed to produce the PIP maps including improved integration with a python version of the NCycle-Irl model. Following a Teagasc review of NCycle, grassland nitrogen inputs are now a related to the farm-level stocking rate.
If you would like to ask questions, contact us at catchments@epa.ie
Download the PIP Maps
You can download the PIP maps from the EPA’s Data Portal:
https://gis.epa.ie/GetData/Download
See Water / Water Framework Directive – General Information – Pollution Impact Potential Maps (PIP-N and PIP-P) – 12/11/2021


