What does the marine area tell us about upstream conditions?…
Water Quality and Agriculture: Pollution Impact Potential Maps – A tool to guide resources into areas for further investigation
Currently the EPA is evaluating the sources of pollution or pressures (called ‘significant pressures’) causing unsatisfactory water quality as a means of identifying mitigation measures and environmental objectives for inclusion in the next Water Framework Directive River Basin Management Plans.
The EPA Water Quality in Ireland (2010-12) Report highlighted that 53% of suspected causes of pollution in rivers are from agriculture while 34% are from municipal sources. In the Suir catchment, significant pressures have been identified in 66 (34%) of the surface water bodies, with agriculture a significant pressure in 36 (19%) of the water bodies. Agricultural pressures can arise from point sources, for example, farmyards, or diffuse sources most often associated with land spreading of fertilizers (organic and inorganic). While farmyards (and septic tank systems) are easy to identify as potential pressures, diffuse sources are much more difficult to locate.
As the philosophy being followed to improve our water quality where needed is “the right measure in the right place”, investigative assessments are being recommended as the means of locating the significant pressures (see article page 20), including from diffuse sources. To help reduce the amount of investigative assessments required and therefore the time and resources needed, a Catchment Characterisation Tool has been developed to produce Pollution Impact Potential (PIP) maps that show the potential critical source areas for agricultural diffuse nutrients in our water bodies and subcatchments. The Pollution Impact Potential maps rank the relative risk areas for diffuse phosphorus to surface water and diffuse nitrogen to surface and groundwater. These maps are now available to all public bodies on the WFD Application.
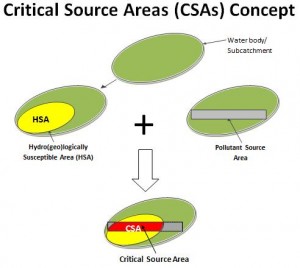
What are Critical Source Areas?
Critical sources areas are areas that deliver a disproportionally high amount of pollutants compared to other areas of a water body or subcatchment, and represent the areas with the highest risk of impacting a water body. In order to determine where critical source areas are located, we need to determine the hydro(geo) logical susceptibility of the water body and also the nutrient loadings applied to that water body.
Susceptibility Maps
High hydro(geo)logically susceptible areas are areas from which nutrients have a high probability of reaching a water body of
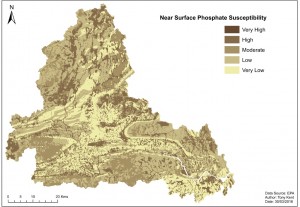
interest due to the underlying hydrogeological conditions, that is the areas that have significant pathway linkages from the source of pollution or pressure to surface water or groundwater receptors. Susceptibility maps are generated by linking data on soils, subsoils, groundwater vulnerability and aquifer types with nutrient attenuation and transport factors. These maps are now available for phosphate along the near surface pathway, and for nitrate along the near surface and groundwater pathways. The map below shows the susceptibility map for phosphate along the near surface pathway for the Suir Catchment. The darker areas (or Very High and High categories) are areas that are most susceptible to transporting phosphate along the near surface water pathway to rivers and lakes. You can find national susceptibility maps on catchments.ie/maps
Pollution Impact Potential Maps
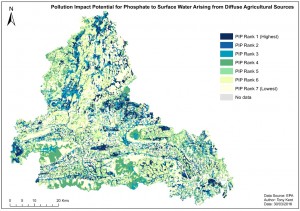
The susceptibility maps are combined with nutrient loadings data provided by the Department of Agriculture, Food and the Marine and the Central Statistics Office to produce Pollutant Impact Potential maps. The Pollutant Impact Potential map for phosphate to surface water for the Suir Catchment is shown below. The darkest blue areas (PIP rank
1) are the critical sources areas (or the highest risk areas) and all areas are ranked relative to this area. These high risk areas for phosphate to surface water coincide with poorly drained areas, meaning that in these areas phosphate is more likely to flow overland to surface waters rather than being retained in the soil and subsoil. Similar maps are available for nitrate in surface water and groundwater.
How should Pollution Impact Potential maps be used?
In the catchment areas of water bodies with unsatisfactory water quality, Pollution Impact Potential maps have been developed to help focus on the areas and sources that might be causing the impacts. They act as a first step in the characterisation process by targeting areas for further Investigative Assessment at a water body and subcatchment scale.
They are available at a maximum scale of 1:20,000 (e.g. water body scale) and are not designed or suitable to be used on their own as a basis for decisions at a farm or field scale.
Where diffuse agriculture is considered to be a significant pressure, Investigative Assessment enabling site and field-based assessment should be focused initially in the high risk (Pollution Impact Potential rank) areas i.e. the critical source areas. The maps act as a signpost to where there is a potential critical source area. However, the location of farmland in critical source areas does not necessarily mean that they are a significant pressure, as best management practices may already be in place. For phosphate, point
sources are more likely to be an issue in high risk areas (PIP Rank 1-3) as these areas are likely to have a higher density of drains and ditches acting as a pathway from farmyards
to water bodies. The public bodies responsible for Investigative Assessments will ‘ground truth’ the maps and liaise with farmers and agricultural advisors to further refine the
locations of the diffuse sources using farm scale information such as nutrient management plans. The outcome of this process will inform where mitigation measures are required, and what the most appropriate measure is likely to be.


