What does the marine area tell us about upstream conditions?…
What’s flowing into the Suir? Results from nutrient load apportionment modelling
Imagine you are out for a walk along the river Suir, and stop for tea and a delicious slice of pie. Later that week you try to recreate the pie at home. You think you know the ingredients, but how do you know what amounts of each to use? And what if you miss a key ingredient?
In a similar manner, we can monitor the nutrients in the river, but it is not so easy to determine exactly where they came from. Some sources are easy to identify, such as discharges from waste water treatment plants and industry that are piped into the water. Other sources of nutrients may be less visible, and reach the river via groundwater. Even if the possible sources are identified, how can we tell what proportions they contributed to the total quantities found in the river? Previously, methods have calculated the piped, or ‘point’, discharges, and estimated that the remaining nutrient are from ‘diffuse’ sources, typically agriculture. The issue with this approach is that the total in-stream load is actually an estimate which can have errors and, importantly, there may be other unknown point or diffuse sources contributing nutrients.
To overcome this, a data-driven model has been developed for predicting the sources of nutrient loads (phosphorus and nitrogen) to water by the EPA CatchmentTools Project. The Source Loading Apportionment Model (SLAM) uses the best national data and research to quantify nutrient losses from both point discharges (urban waste water, industry
and septic tank systems) and diffuse sources (pasture, arable, forestry, peatlands etc.). This model integrates catchment data and pressure information to enable characterisation of Source-Pathway- Receptor relationships. Hydro(geo)logical controls have a strong impact on nutrient fluxes, particularly in agricultural catchments, and have been incorporated into the diffuse agricultural
Results show that the variation in the sources of phosphorus across the Suir generally reflects the locations of populated areas. Urban waste water accounts for between 1% to 90% of phosphorus in subcatchments of the Suir. Pasture is the other main source of phosphorus (see the other pieces of the pies below ). There is a lot less variation in the sources of nitrogen, with pasture being the dominant source across all sub-catchments in the Suir.
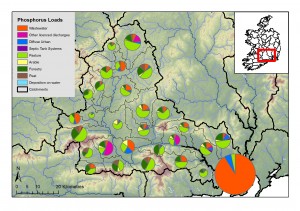
Where rivers and lakes are impacted by excess nutrients, we need to understand the sources of those nutrients before mitigation measures can be selected. In these areas, modelling can be used in conjunction with knowledge from local authorities and investigative assessments to identify significant pressures that contribute excessive nutrients to surface waters. In the Suir catchment, only a relatively small proportion of the catchment requires a reduction in phosphorus emissions to achieve Good Status. Modelling future scenarios can support catchment scientists and managers in identifying appropriate options for measures.
Just as pie making isn’t an exact science, modelling the sources of river nutrients can have errors and unknowns. Nonetheless, we can use these results to help support decision making and the integrated catchment management process and, ultimately, to improve our ecosystems and environment.
Further information on the EPA CatchmentTools Project can be found at cwrr.ucd.ie/cmst

